Dashboard Builder
The Dashboard Builder lets you create custom dashboards by selecting and arranging widgets. Build role-specific or department-specific views with the metrics that matter most.
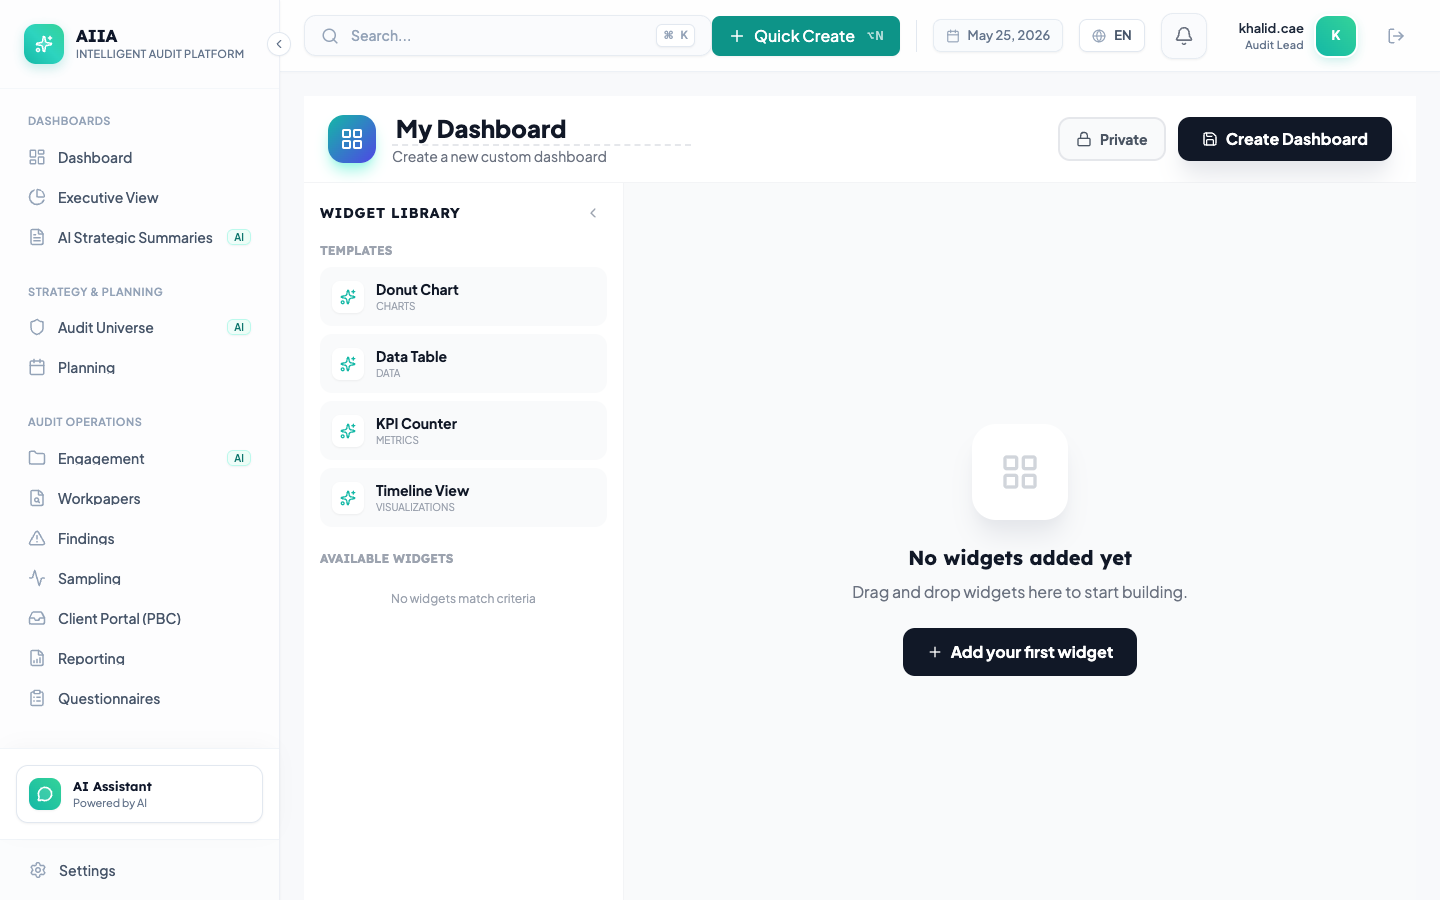
Creating a Custom Dashboard
- Navigate to Dashboards → + New Dashboard
- Give it a name (e.g., "IT Audit Quarterly View")
- The builder canvas opens with an empty grid
Adding Widgets
Click + Add Widget and select from:
| Widget Type | Description | Configuration |
|---|---|---|
| Metric Card | Single KPI with trend | Select metric, date range |
| Bar Chart | Categorical comparison | Select data source, grouping |
| Line Chart | Trend over time | Select metric, time range |
| Pie/Donut | Distribution breakdown | Select dimension, values |
| Table | Tabular data view | Select columns, filters |
| KRI Gauge | KRI with threshold bands | Select KRI |
| Activity Feed | Recent audit log events | Filter by module |
| Findings Heat Map | Severity × Status matrix | Select engagements |
Layout
- Drag widgets to reposition them on the grid
- Resize widgets by dragging edges
- The grid auto-adjusts for responsive display
Data Sources
Widgets pull from DashboardMetric records:
| Source | Examples |
|---|---|
| Engagements | Count by status, duration trends |
| Findings | Severity distribution, aging analysis |
| Action Plans | Completion rates, overdue counts |
| KRIs | Current values, threshold status |
| Universe | Coverage metrics, risk scores |
| Audit Logs | Activity volume, user actions |
Sharing
- Private — only you can see the dashboard
- Team — visible to your role group
- Public — visible to all users in your organization
- Pinned — set as the default dashboard for a role
Permissions
| Action | Auditor | Manager | CAE | Admin |
|---|---|---|---|---|
| Create dashboards | ✅ | ✅ | ✅ | ✅ |
| Edit own dashboards | ✅ | ✅ | ✅ | ✅ |
| Share with team | ❌ | ✅ | ✅ | ✅ |
| Pin as default | ❌ | ❌ | ✅ | ✅ |